Incorporating infographics into your nonprofit organization’s marketing strategy is an effective way to a) get readers’ attention, b) educate them on a topic and, c) encourage them to take action. This article will walk you through a few different approaches you can take to create an effective infographic for your nonprofit organization.
Annual Report Infographic
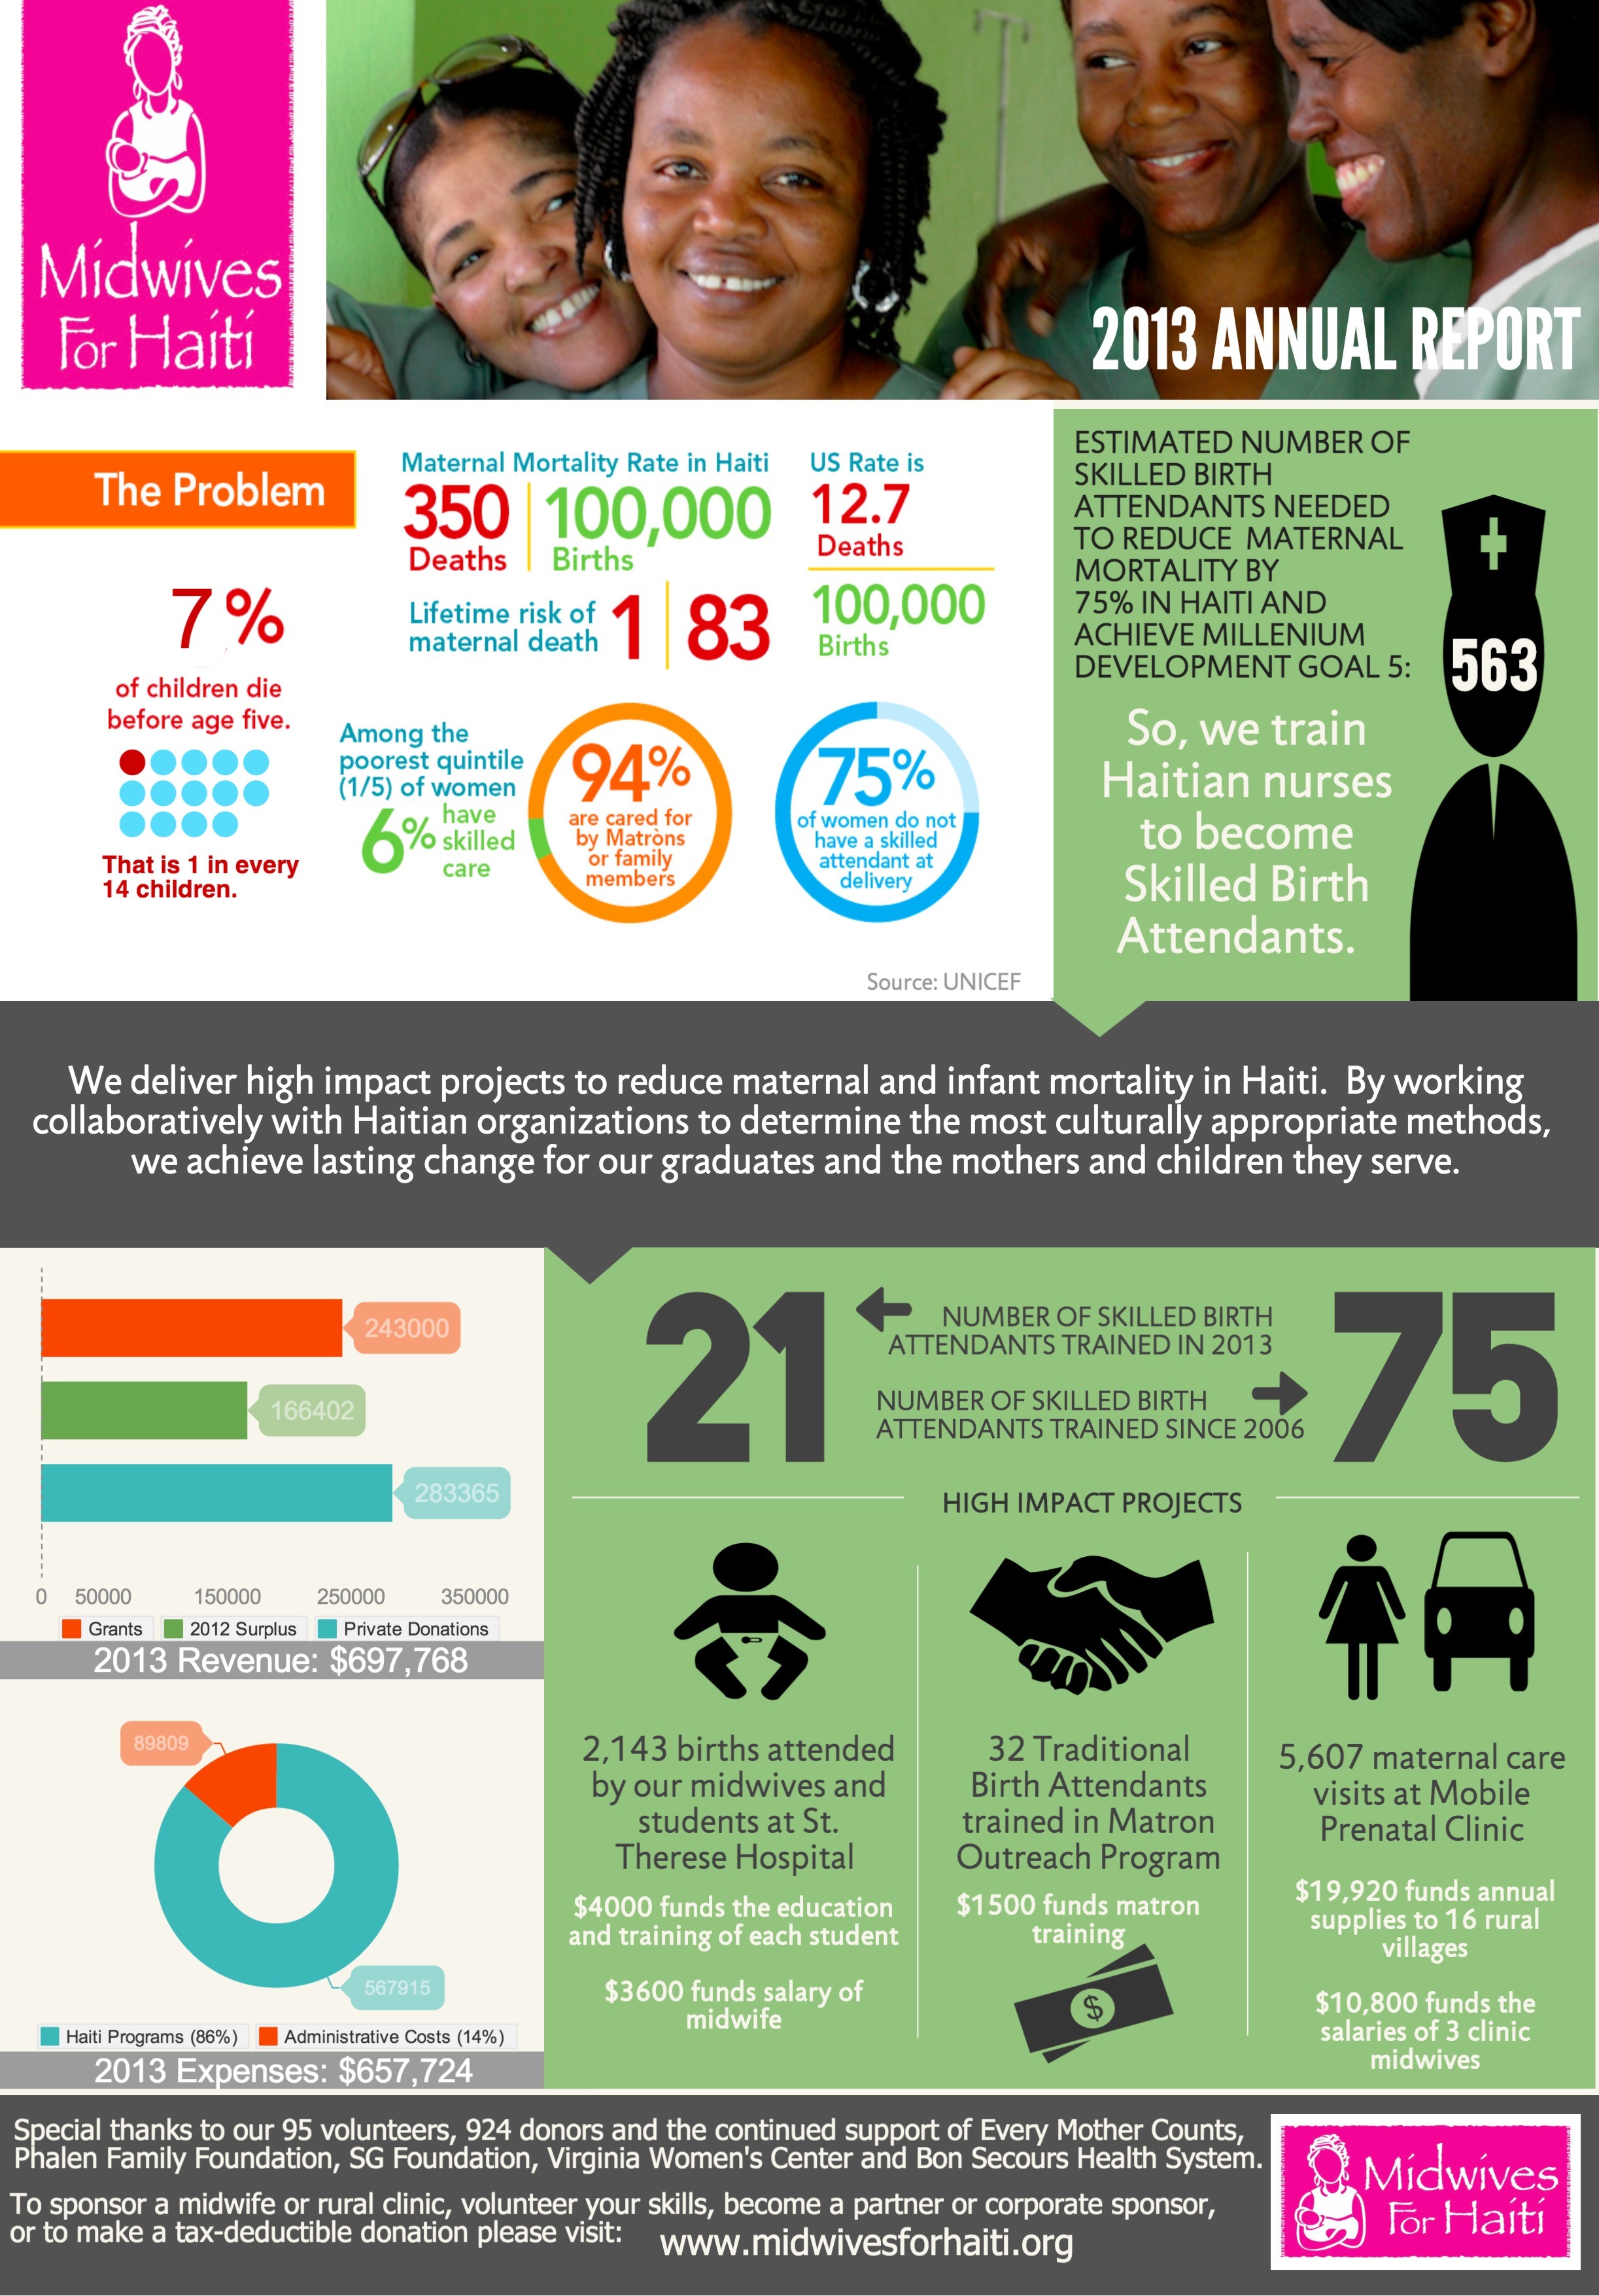
While your nonprofit organization may choose to publish your full annual reports on your website, you can also make a condensed version of an annual report into an infographic to share with your audience on social media. Annual report infographics are typically divided into sections covering different metrics. The metrics covered in an annual report infographic should include impact made by the organization, including amount of money donated, number of families impacted, positive outcomes, etc. The infographic should also offer some details about the impact, such as the demographic of people impacted, the geography of the community impacted, and other contextual information. The infographic should also show key financial metrics, such as funding raised, expense categories, effectiveness of delivery, and goal for the coming year. Take this example from the Midwives for Haiti. The infographic clearly states the year it covers, and uses a combination of large text, pictograms, charts and photographs of people to highlight important metrics in a visually interesting way.
Problem Infographic
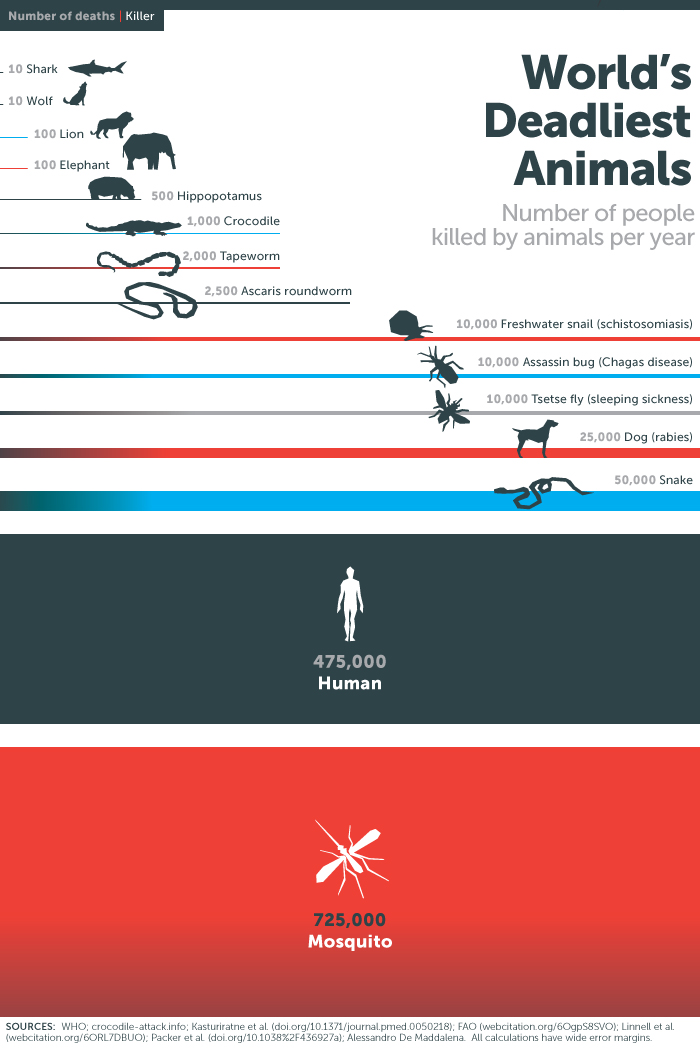
Your nonprofit organization was created for a reason: to try and solve a problem. An effective way to engage new audiences is to introduce them to that problem that needs solving. To grab readers’ attention, feature a compelling statistic in large font, or a chart showing compelling data. Forcing readers out of their comfort zone with a shocking statistic will cause them to stop and reflect on the problem, and will hopefully spur them to take action. A good way to make data impactful is to compare it to other data. For example, take this popular infographic posted on Bill Gates’ blog. The infographic compares the number of deaths caused by the Earth’s largest predators versus the number of death caused by tiny mosquitoes. The number is huge, which may come as a shock to many readers.
Solution Infographic
In the same vein as the problem infographic, a solution infographic focuses on that your nonprofit is doing to solve a problem. To do this, you will need to provide some contextual information about the problem before focusing the majority of the infographic on the solution. Like when creating a problem infographic, numbers in large fonts and charts will make data more attention-grabbing. A good approach to make your solution infographic compelling is to show how different or unique your solution is from other solutions. What makes your organization exceptional and worth supporting? You should also show readers the bigger picture of how your solution will impact the problem. For example, this infographic by World Vision shows how buying a goat for a family or small community can significantly reduce the need for food for the people who receive it. World Vision positions buying the goat in someone’s name as an alternative to a more traditional gift.
Impact Infographics
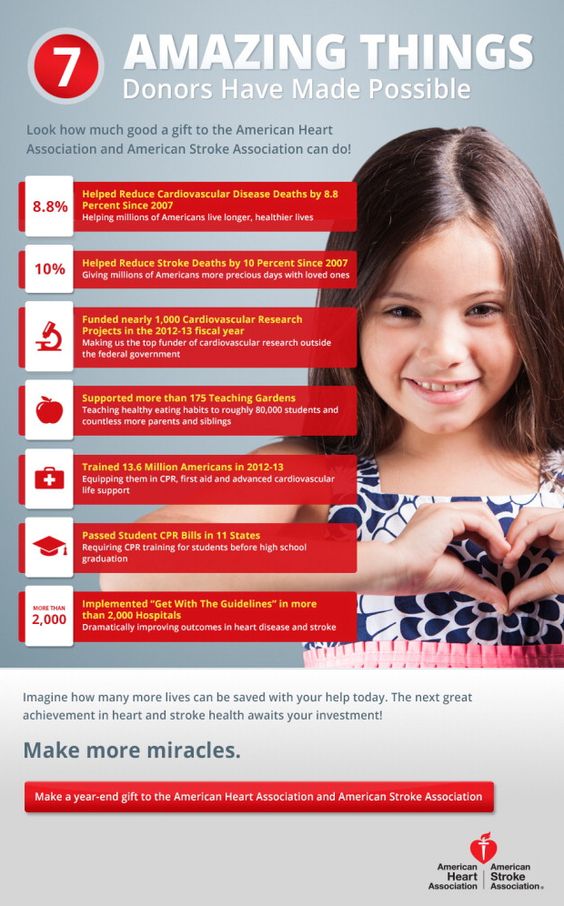
While a solution infographic will touch on the impact of your nonprofit organization’s solution, an impact infographic puts the focus on the impact. You can do this by sharing success stories or personal stories that connect the audience to individual people being helped. Using pictures of people is an effective design tactic, as it will add human faces to the numbers. Take this impact infographic by the American Heart Association and the American Strokes Association. Seven metrics showing success are placed over a happy child, encouraging readers to draw connections between the numbers and the individual people who are impacted by donations.
Campaign Infographic
If you are promoting a particular campaign, an infographic is a fun and effective way to introduce audiences to a problem and how your campaign aims to fix it. A campaign infographic should focus on the basics of what the campaign is about, what the time frame is, and how people can participate. Your goal is to get people on board, so make it as fun and interesting as you can. A call to action is essential here (really, any infographic you make for your nonprofit organization should include a CTA), since you want people to take the next step after reading your infographic. You can call readers to action by asking them to sign up for a newsletter, asking them to donate now by clicking on a link, asking them to share the infographic on their social media, or by asking them to visit a specific landing page for more details. This infographic made by Sortable to promote Movember introduces readers to the cause, then lists silly moustache suggestions to entertain readers and to encourage them to participate. The infographic ends with a call to action asking readers to go to the Movember website and make a donation.
If you’re not sure where to begin when designing an infographic for your nonprofit organization, using an infographic template is a good place to start. Featured photo credit: http://getrefe.tumblr.com/ via 67.media.tumblr.com


